Claude Shannon introduced us in 1948 to the Entropy of Information. Since then, a lot of interpretations were made about the entropy value of something, such as “measurement of order” or “amount of information”.
But when dealing with images, what does entropy mean? Some works verified that the entropy of an image could be used, for example, for measuring its visual aspects (Tsai, Lee, and Matsuyama, 2008) or for gathering information to be used as parameters in some systems (Min et al., 2013). Another widely used interpretation (which I’m using on my Ph.D.) is for measuring the amount of information within an image.
Imagine a 1920×1080 image with 10000 colorful dots and another one with only 5 gray dots. It is easy for us to know which one has more visual information, however, to the computer, this is not a trivial task. Well, it would be, if we did not have the entropy equation.
The equation
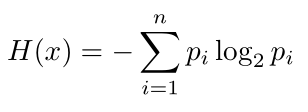
It is possible to calculate the entropy H(x) using the following equation:
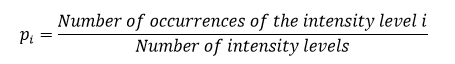
The pi value is the occurrence probability of a given symbol. Here, the symbols are the pixels. To simplify it, let’s consider a single-channel 8-bit image (256 intensity levels), then we can compute pi value as follows:
Coding the Entropy
First, we need something to represent the number of occurrences of each intensity value. In other words, we need the image’s histogram. I decided to use Java code examples, the reason I explain at the end of this post.
The function buildHistogram below is responsible for computing the histogram:
1 2 3 4 5 6 7 8 9 10 11 12 13 14 15 16 17 | /* Create a array of ints, representing the histogram of a given image * @param BufferedImage originalImage - The image to be processed * @param int numberOfBins - Number of histogram bins * @return int bins[] - The array containing the occurrence of each intensity pixel (the histogram) */ public static int[] buildHistogram(BufferedImage image, int numberOfBins){ int bins[]=new int[numberOfBins]; int intensity ; image=getGrayScale8bits(image); for (int i = 0 ; i <= image.getWidth()-1 ; i++){ for (int j=0 ;j <= image.getHeight()-1 ; j++){ intensity = image.getRGB(i,j) & 0xFF; bins[intensity]++; } } return bins; } |
Now is possible to compute the probability of the occurrence of each intensity value, diving each value of the array bin[] by the number of intensities. This is done in the snippet below, which also calculate the entropy:
1 2 3 4 5 6 7 8 9 10 11 12 13 14 15 16 17 18 | /* Compute the entropy of an image based on the Shannon's Formula * @param BufferedImage originalImage - The image to be processed * @param int maxValue - The maximum value of intensity pixels, the same number as the histogram bins * @return int entropyValue - The entropy value */ public static double getEntropy(BufferedImage image, int maxValue){ int bins[] = buildHistogram(image,maxValue); double entropyValue = 0,temp=0; double totalSize = image.getHeight() * image.getWidth(); //total size of all symbols in an image for(int i=0;i<maxValue;i++){ //the number of times a sybmol has occured if(bins[i]>0){ //log of zero goes to infinity temp=(bins[i]/totalSize)*(Math.log(bins[i]/totalSize)); entropyValue += temp; } } return entropyValue*(-1); } |
The sum of the equation is done in a For loop going from 0 to the size of the bins in the histogram. The line: temp=(bins[i]/totalSize)*(Math.log(bins[i]/totalSize)); computes pi which is summed in the entropyValue variable. The function then returns entropyValue multiplied by (-1), completing the equation.
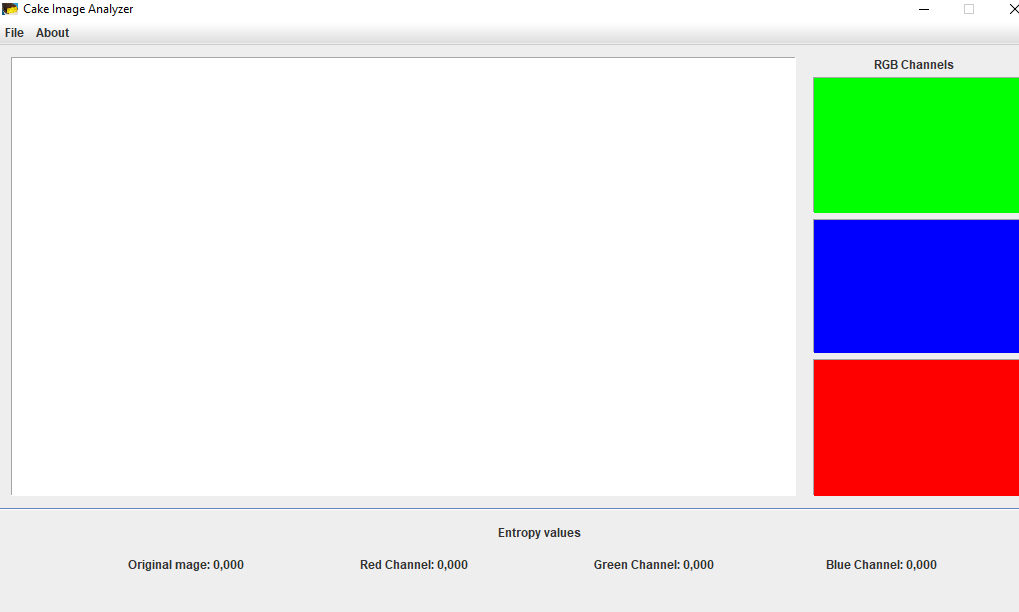
Cake Image Analyzer
All the code above came from a small program called Cake Image Analyzer that I coded for helping people to see the entropy value of an image.
To change a little, and to be more portable, I used Java and the BufferedImage class, so, no additional libraries were used.
What about the name? Well, try to guess what I was eating when I first started the project.
Screenshots and Examples
To show the program, I used 2 images from the city of Ilha Solteira – São Paulo: The dam (Figure 1) and the Water Tank monument (Caixa d’agua) (Figure 2).
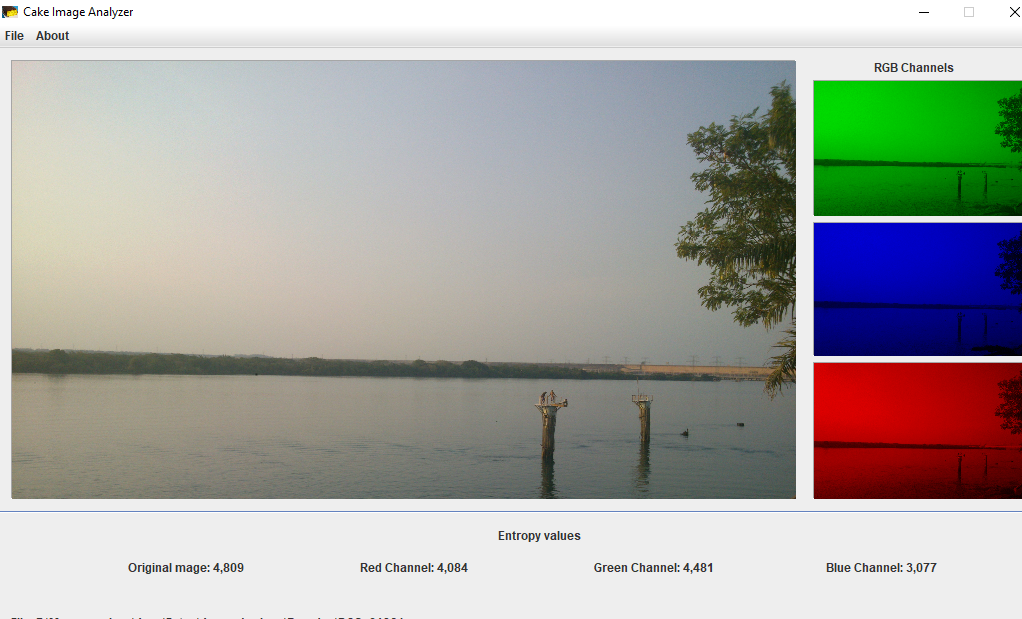
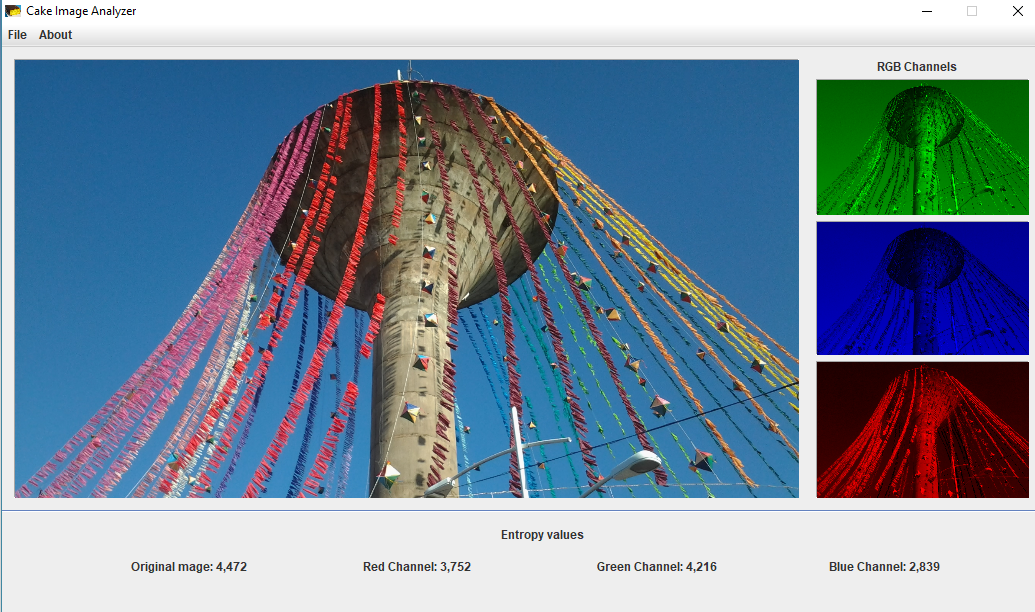
As we can see, the first image has a higher entropy value than the second one. In, other words we could say that it contains more information. What about an image containing only pixels of the same intensity?
Zero, Figure 3 showed an image without variation, information, and no disorder.
Where can I find the Cake Image Analyze App?
The code is available on my GitHub page as usual. If you just want to download the executable to use on your images, click here.
Have fun with your projects!
If this post helped you, please consider buying me a coffee 🙂


I got what you intend, thanks for putting up. Woh I am glad to find this website through google.
Very interesting information!Perfect just what I was searching for!
There is a typo in the p_i formula. The denominator should be ‘number of pixels’ instead of number of levels.