When trying to segment desired regions of an image, sometimes we need more than one algorithm. K-means is very often one of them.
As a non-supervised algorithm, it demands adaptations, parameter tuning and a constant feedback from the developer, therefore, an understanding its concepts is essential to use it effectively.
Basics
K-means is an algorithm for solving data clustering problems. Such as the one shown in Figure 1.
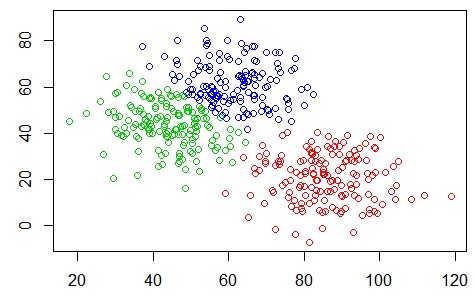
There are 3 distinct data groups in Figure 1. We can see them clearly, but how could the computer separate them? That’s where the K-means algorithm comes in: to identify the data to the group it belongs. The algorithm does the following steps:
- Randomly initialize K points, called means (now you also know why it’s named K-means).
- Categorize each item (pixels or any kind of data) to its closest mean.
- Update the mean’s coordinates, which are the averages of the items categorized in that mean so far.
- Repeat the process for an n number of iterations.
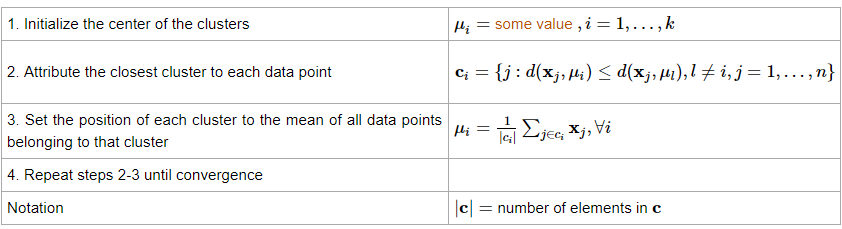
Formally, the algorithm can be mathematically described as this amazing table available on the OnMyPhD website:
By now, it’s not a surprise to say that the K points need to be fixed a priori. Usually, it is defined by how many groups you want to separate the data. So, choosing the right K value plays a big role in the parameter tuning of the code… Talking about code, guess who has a very functional implementation of K-means? Our friend OpenCV.
Coding
Let’s use the good ol’ C++ here, as usual. The function that does (almost) all the jobs is the cv::means(); , the header is:
1 | kmeans(InputArray data, int K, InputOutputArray bestLabels, TermCriteria criteria, int flags, OutputArray centers) |
The parameters, as shown in the OpenCV documentation:
- data: Data for clustering (an array of N-Dimensional points with float coordinates (the image needs to be converted into an array.).
- K: Number of clusters you want to split the image.
- bestLabels: Input/output integer array that stores the cluster indices for every sample.
- criteria: The algorithm termination criteria, the type contains:
- type: The type of termination criteria, one of TermCriteria::Type;
- maxCount: The maximum number of iterations or elements to compute;
- epsilon: The desired accuracy or change in parameters at which the iterative algorithm stops.
- flags: Flag that can take the following values:
- KMEANS_RANDOM_CENTERS Select random initial centers in each attempt;
- KMEANS_PP_CENTERS Use kmeans++ center initialization by Arthur and Vassilvitskii [Arthur2007];
- KMEANS_USE_INITIAL_LABELS During the first (and possibly the only) attempt, use the user-supplied labels instead of computing them from the initial centers. For the second and further attempts, use the random or semi-random centers. Use one of KMEANS_*_CENTERS flag to specify the exact method.
- centers: Output matrix of the cluster centers, one row per each cluster center.
To use it in an effective way, It’s necessary to do some adaptations on the image and create auxiliary Mats and arrays. A minimal working code could be:
1 2 3 4 5 6 7 | const unsigned int singleLineSize = sourceImage.rows * sourceImage.cols; const unsigned int K = 10; Mat data = sourceImage.reshape(1, singleLineSize); data.convertTo(data, CV_32F); std::vector<int> labels; cv::Mat1f colors; cv::kmeans(data, K ,labels,cv::TermCriteria(cv::TermCriteria::EPS+cv::TermCriteria::COUNT, 10, 1.),MAX_ITERATIONS,cv::KMEANS_PP_CENTERS,colors); |
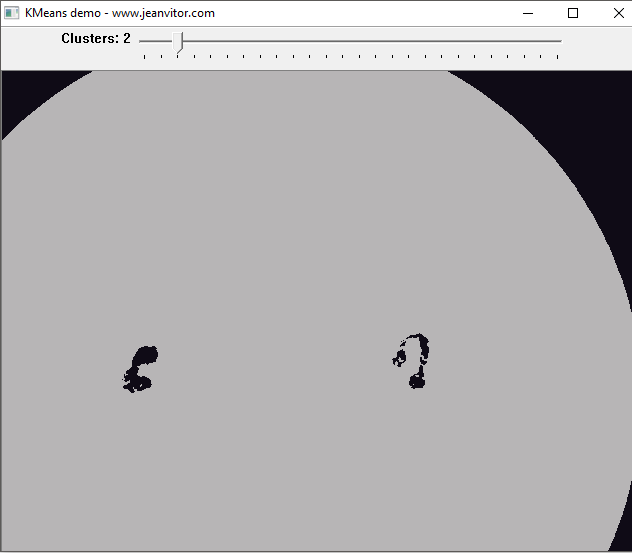
I coded a small program to display an image as you change the number of clusters, so, it’s possible to see how the K-means’ output will be, in “real-time”. The code is available on my Github.
Let’s use this program in a real-world application. Have a look at Figure 3.
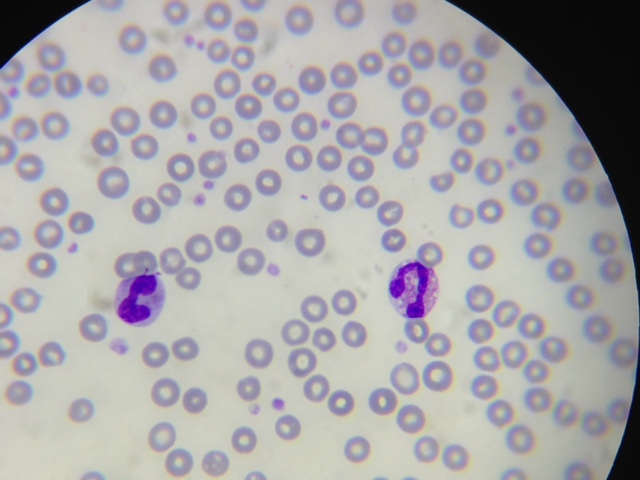
It is a blood smear, observed by a microscope, containing leukocytes and red blood cells. Being very generalist, the light-purple dots are red blood cells, and the darker-purple ones, are leukocytes.
Let’s say we want to extract just the nucleus of the leukocytes, starting the pre-processing step with K-means with K = 5.
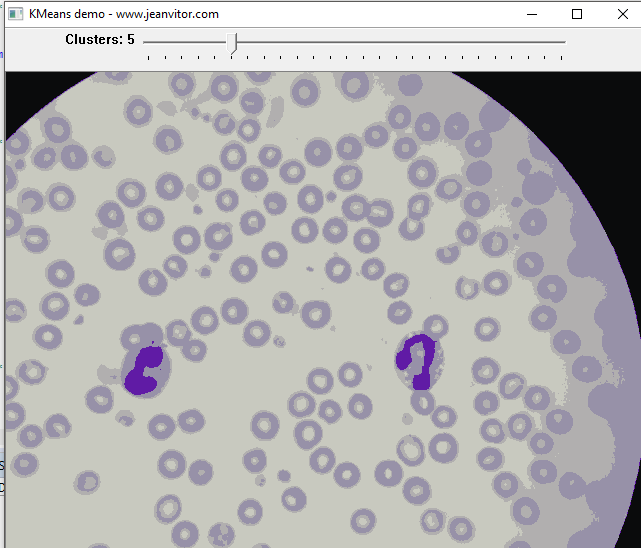
That’s very nice! It is already possible to see the highlighted parts of the nucleus because of its different color in relation to the other components of the image. What about lowering K even more?
Now it’s possible to see just the leukocytes’ nucleus, this is a truly amazing result. Of course, this is very close to an ideal case, but it’s enough to see the power of K-means.
Should I use K-means?
It works very well most of the time, but it’s not perfect. There are some drawbacks such as images with high overlapping data clusters, noisy data, not spherical clusters and different scatters, that you will need to consider in your project’s design phase. Since it’s not complex to understand and implement, I always suggest giving it a try.


No Comment! Be the first one.